Expose TorchServe Metrics
This tutorial setups prometheus and granfana to the cluster with TorchServe metrics.
Install Istio with Grafana and Prometheus
Note: Make sure to enable prometheus and grafana while installing istio.
After installation Grafana and Prometheus can be accessed from the below links
# Grafana
istioctl dashboard grafana

# Prometheus
istioctl dashboard prometheus
Create the InferenceService
Enable prometheus scraping by adding annotations to deployment yaml, by default the torchserve's metrics port is 8082.
apiVersion: serving.kserve.io/v1beta1
kind: InferenceService
metadata:
  name: "torch-metrics"
  annotations:
    prometheus.io/scrape: 'true'
    prometheus.io/port: '8082'
spec:
  predictor:
    pytorch:
      storageUri: gs://kfserving-examples/models/torchserve/image_classifier/v1
apiVersion: serving.kserve.io/v1beta1
kind: InferenceService
metadata:
  name: "torch-metrics"
  annotations:
    prometheus.io/scrape: 'true'
    prometheus.io/port: '8082'
spec:
  predictor:
    model:
      modelFormat:
        name: pytorch
      storageUri: gs://kfserving-examples/models/torchserve/image_classifier/v1
Apply the CRD
kubectl apply -f metrics.yaml
Expected Output
$inferenceservice.serving.kserve.io/torch-metrics created
Run a prediction
The first step is to determine the ingress IP and ports and set INGRESS_HOST and INGRESS_PORT
MODEL_NAME=mnist
SERVICE_HOSTNAME=$(kubectl get inferenceservice torch-metrics <namespace> -o jsonpath='{.status.url}' | cut -d "/" -f 3)

curl -v -H "Host: ${SERVICE_HOSTNAME}" http://${INGRESS_HOST}:${INGRESS_PORT}/v1/models/${MODEL_NAME}:predict -d @./mnist.json
Expected Output
*   Trying 52.89.19.61...
* Connected to a881f5a8c676a41edbccdb0a394a80d6-2069247558.us-west-2.elb.amazonaws.com (52.89.19.61) port 80 (#0)
> PUT /v1/models/mnist:predict HTTP/1.1
> Host: torch-metrics.kserve-test.example.com
> User-Agent: curl/7.47.0
> Accept: */*
> Content-Length: 272
> Expect: 100-continue
>
< HTTP/1.1 100 Continue
* We are completely uploaded and fine
< HTTP/1.1 200 OK
< cache-control: no-cache; no-store, must-revalidate, private
< content-length: 1
< date: Fri, 23 Oct 2020 13:01:09 GMT
< expires: Thu, 01 Jan 1970 00:00:00 UTC
< pragma: no-cache
< x-request-id: 8881f2b9-462e-4e2d-972f-90b4eb083e53
< x-envoy-upstream-service-time: 5018
< server: istio-envoy
<
* Connection #0 to host a881f5a8c676a41edbccdb0a394a80d6-2069247558.us-west-2.elb.amazonaws.com left intact
{"predictions": ["2"]}
Check the dashboard
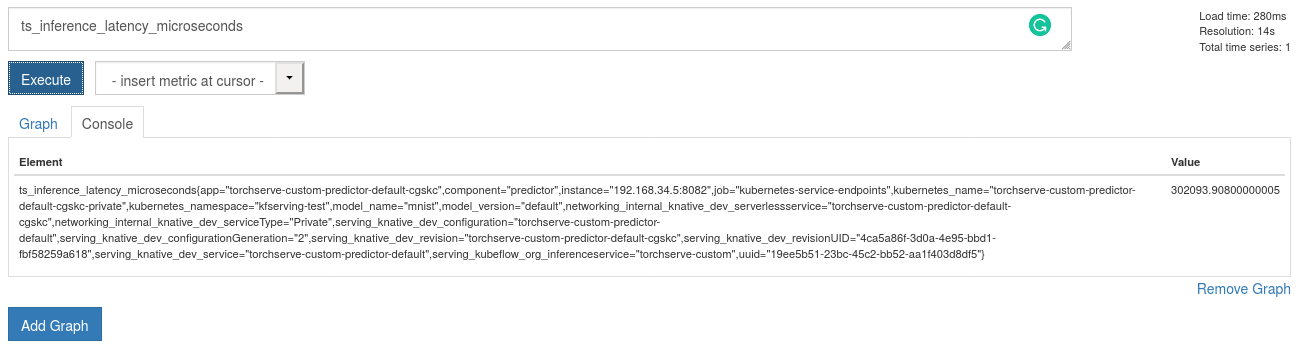
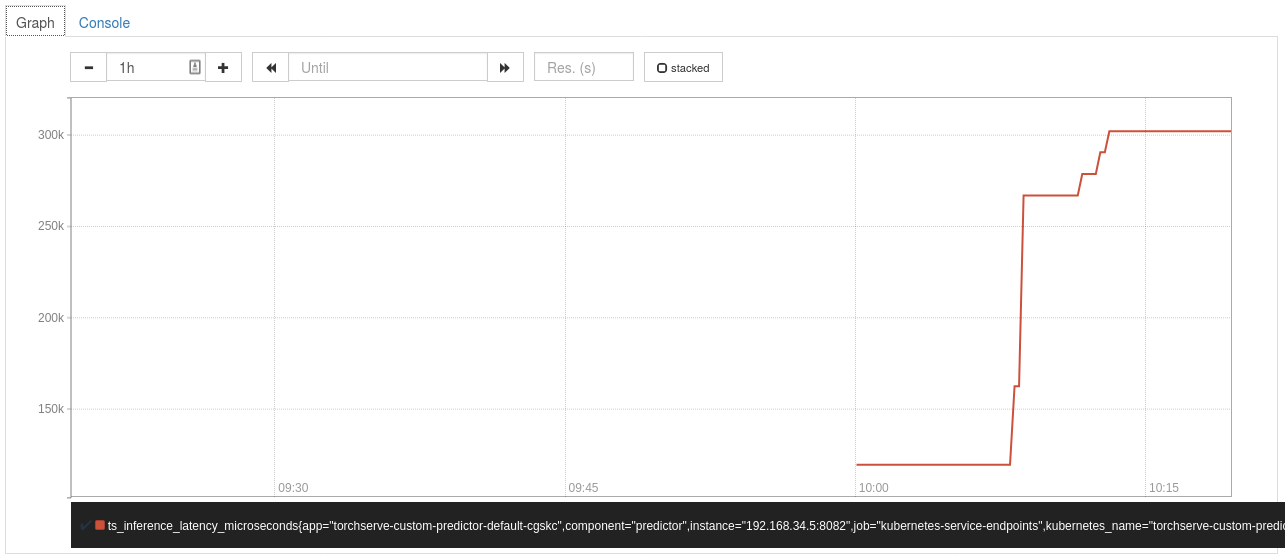
Prometheus graph view
- Navigate to prometheus page
- Add a query in the prometheus page
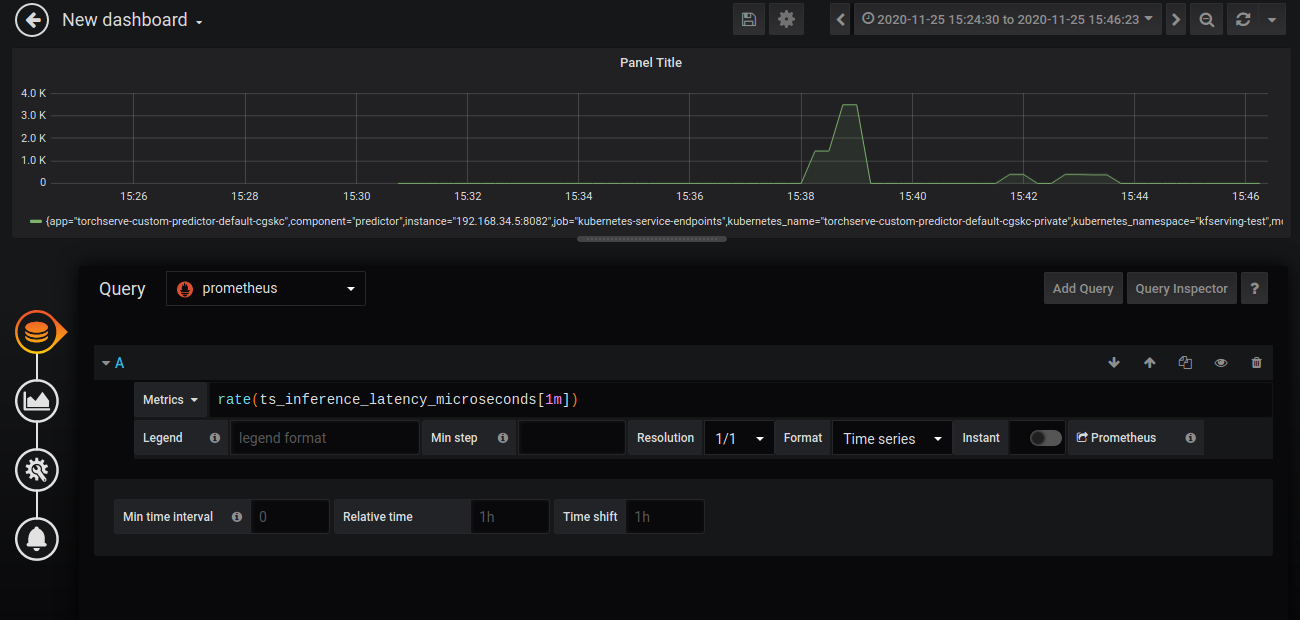
Grafana dashboard
- Navigate to grafana page
- Add a dashboard from the top left + symbol
- Click add query and enter the query
For Exposing grafana and prometheus under istio ingress please refer to remotely accessing telemetry addons
Apply below deployment for a demo setup.
apiVersion: networking.istio.io/v1alpha3
kind: Gateway
metadata:
  name: grafana-gateway
  namespace: istio-system
spec:
  selector:
    istio: ingressgateway
  servers:
  - port:
      number: 80
      name: http-grafana
      protocol: HTTP
    hosts:
    - "grafana.example.com"
---
apiVersion: networking.istio.io/v1alpha3
kind: VirtualService
metadata:
  name: grafana-vs
  namespace: istio-system
spec:
  hosts:
  - "grafana.example.com"
  gateways:
  - grafana-gateway
  http:
  - route:
    - destination:
        host: grafana
        port:
          number: 3000
---
apiVersion: networking.istio.io/v1alpha3
kind: DestinationRule
metadata:
  name: grafana
  namespace: istio-system
spec:
  host: grafana
  trafficPolicy:
    tls:
      mode: DISABLE
---
All request with hostname grafana.example.com redirects to grafana.