Autoscaling with Knative Pod Autoscaler
KServe leverages Knative Pod Autoscaler (KPA) to automatically scale your inference services based on incoming load.
The Knative Pod Autoscaler is only supported in Knative deployment mode.
Prerequisites
Before you begin, make sure you have:
- A Kubernetes cluster with KServe installed.
- The
kubectlcommand-line tool installed and configured. - The
heytool installed for load testing (used in this guide to generate traffic). - [Optional] Grafana and Prometheus installed for monitoring.
Autoscaling with Target Concurrency
Create an InferenceService
Apply the TensorFlow example with scaling target set to 1. The annotation autoscaling.knative.dev/target is a soft limit rather than a strictly enforced limit. If there is a sudden burst of requests, this value can be exceeded.
apiVersion: "serving.kserve.io/v1beta1"
kind: "InferenceService"
metadata:
  name: "flowers-sample"
spec:
  predictor:
    scaleTarget: 1
    scaleMetric: concurrency
    model:
      modelFormat:
        name: tensorflow
      storageUri: "gs://kfserving-examples/models/tensorflow/flowers"
Apply the InferenceService:
kubectl apply -f kpa-autoscaler.yaml
inferenceservice.serving.kserve.io/flowers-sample created
Autoscale InferenceService with Concurrent Requests
The first step is to determine the ingress IP and ports and set INGRESS_HOST and INGRESS_PORT. For more details on how to do this, see the Predictive First InferenceService guide.
Send traffic in 30 seconds spurts maintaining 5 in-flight requests using sample input data:
MODEL_NAME=flowers-sample
INPUT_PATH=input.json
SERVICE_HOSTNAME=$(kubectl get inferenceservice $MODEL_NAME -o jsonpath='{.status.url}' | cut -d "/" -f 3)

hey -z 30s -c 5 -m POST -host ${SERVICE_HOSTNAME} -D $INPUT_PATH http://${INGRESS_HOST}:${INGRESS_PORT}/v1/models/$MODEL_NAME:predict
Summary:
  Total:	30.0193 secs
  Slowest:	10.1458 secs
  Fastest:	0.0127 secs
  Average:	0.0364 secs
  Requests/sec:	137.4449

  Total data:	1019122 bytes
  Size/request:	247 bytes

Response time histogram:
  0.013 [1]	|
  1.026 [4120]	|■■■■■■■■■■■■■■■■■■■■■■■■■■■■■■■■■■■■■■■■
  2.039 [0]	|
  3.053 [0]	|
  4.066 [0]	|
  5.079 [0]	|
  6.093 [0]	|
  7.106 [0]	|
  8.119 [0]	|
  9.133 [0]	|
  10.146 [5]	|


Latency distribution:
  10% in 0.0178 secs
  25% in 0.0188 secs
  50% in 0.0199 secs
  75% in 0.0210 secs
  90% in 0.0231 secs
  95% in 0.0328 secs
  99% in 0.1501 secs

Details (average, fastest, slowest):
  DNS+dialup:	0.0002 secs, 0.0127 secs, 10.1458 secs
  DNS-lookup:	0.0002 secs, 0.0000 secs, 0.1502 secs
  req write:	0.0000 secs, 0.0000 secs, 0.0020 secs
  resp wait:	0.0360 secs, 0.0125 secs, 9.9791 secs
  resp read:	0.0001 secs, 0.0000 secs, 0.0021 secs

Status code distribution:
  [200]	4126 responses
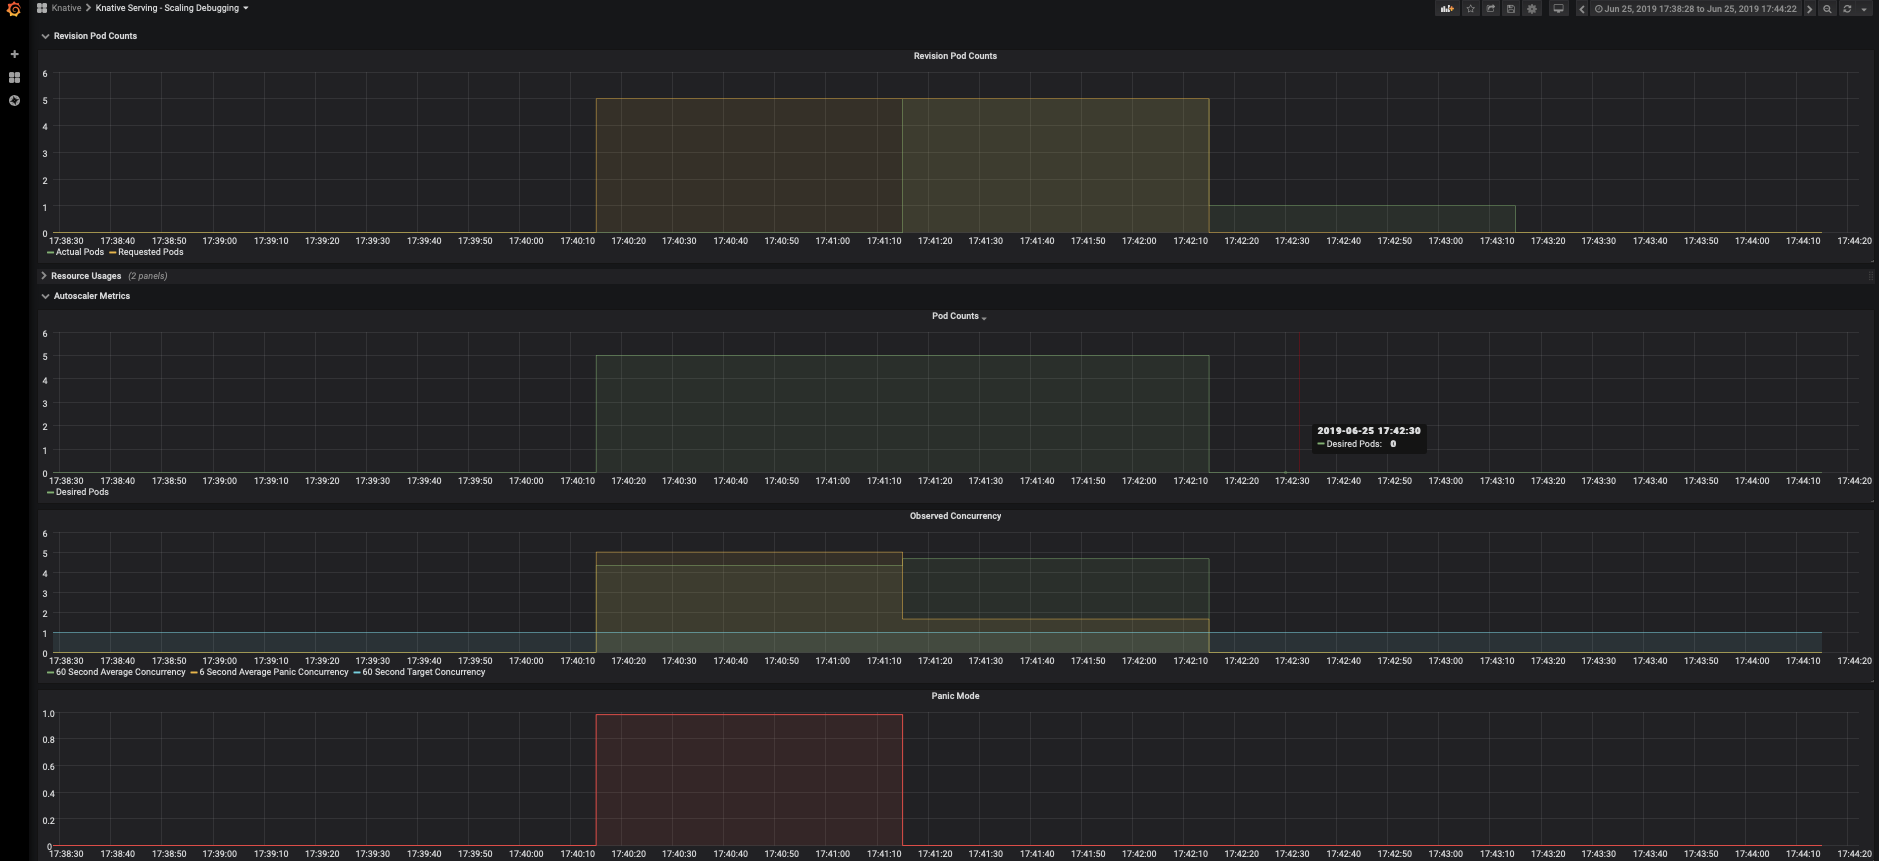
Check the number of running pods now. KServe uses Knative autoscaler which is based on the average number of in-flight requests per pod (concurrency). As the scaling target is set to 1 and we load the service with 5 concurrent requests, the autoscaler tries scaling up to 5 pods. Notice that out of all the requests there are 5 requests on the histogram that take around 10s - that's the cold start time cost to initially spawn the pods and download the model to be ready to serve. The cold start may take longer (to pull the serving image) if the image is not cached on the node that the pod is scheduled on.
kubectl get pods
NAME                                                       READY   STATUS            RESTARTS   AGE
flowers-sample-default-7kqt6-deployment-75d577dcdb-sr5wd         3/3     Running       0          42s
flowers-sample-default-7kqt6-deployment-75d577dcdb-swnk5         3/3     Running       0          62s
flowers-sample-default-7kqt6-deployment-75d577dcdb-t2njf         3/3     Running       0          62s
flowers-sample-default-7kqt6-deployment-75d577dcdb-vdlp9         3/3     Running       0          64s
flowers-sample-default-7kqt6-deployment-75d577dcdb-vm58d         3/3     Running       0          42s
Check Dashboard
If you have configured Grafana and Prometheus, you can view the Knative Serving Scaling dashboards:
kubectl port-forward --namespace knative-monitoring $(kubectl get pods --namespace knative-monitoring --selector=app=grafana --output=jsonpath="{.items..metadata.name}") 3000
Autoscaling with Target QPS
Create the InferenceService
Apply the same TensorFlow example CR but with scaleMetric set to qps:
apiVersion: "serving.kserve.io/v1beta1"
kind: "InferenceService"
metadata:
  name: "flowers-sample"
spec:
  predictor:
    scaleTarget: 1
    scaleMetric: qps
    model:
      modelFormat:
        name: tensorflow
      storageUri: "gs://kfserving-examples/models/tensorflow/flowers"
Apply the InferenceService:
kubectl apply -f kpa-autoscaler-qps.yaml
inferenceservice.serving.kserve.io/flowers-sample created
Test InferenceService with Target QPS
First, determine the ingress IP and ports and set INGRESS_HOST and INGRESS_PORT.
Send 30 seconds of traffic maintaining 50 QPS (queries per second) using sample input data:
MODEL_NAME=flowers-sample
INPUT_PATH=input.json
SERVICE_HOSTNAME=$(kubectl get inferenceservice $MODEL_NAME -o jsonpath='{.status.url}' | cut -d "/" -f 3)

hey -z 30s -q 50 -m POST -host ${SERVICE_HOSTNAME} -D $INPUT_PATH http://${INGRESS_HOST}:${INGRESS_PORT}/v1/models/$MODEL_NAME:predict
Summary:
  Total:	30.0264 secs
  Slowest:	10.8113 secs
  Fastest:	0.0145 secs
  Average:	0.0731 secs
  Requests/sec:	683.5644

  Total data:	5069675 bytes
  Size/request:	247 bytes

Response time histogram:
  0.014 [1]	|
  1.094 [20474]	|■■■■■■■■■■■■■■■■■■■■■■■■■■■■■■■■■■■■■■■■
  2.174 [0]	|
  3.254 [0]	|
  4.333 [0]	|
  5.413 [0]	|
  6.493 [0]	|
  7.572 [0]	|
  8.652 [0]	|
  9.732 [0]	|
  10.811 [50]	|


Latency distribution:
  10% in 0.0284 secs
  25% in 0.0334 secs
  50% in 0.0408 secs
  75% in 0.0527 secs
  90% in 0.0765 secs
  95% in 0.0949 secs
  99% in 0.1334 secs

Details (average, fastest, slowest):
  DNS+dialup:	0.0001 secs, 0.0145 secs, 10.8113 secs
  DNS-lookup:	0.0000 secs, 0.0000 secs, 0.0196 secs
  req write:	0.0000 secs, 0.0000 secs, 0.0031 secs
  resp wait:	0.0728 secs, 0.0144 secs, 10.7688 secs
  resp read:	0.0000 secs, 0.0000 secs, 0.0031 secs

Status code distribution:
  [200]	20525 responses
Check the number of running pods now. We are loading the service with 50 requests per second, and from the dashboard, you can see that it hits the average concurrency of 10, and the autoscaler tries scaling up to 10 pods.
Check Dashboard
View the Knative Serving Scaling dashboards (if configured):
kubectl port-forward --namespace knative-monitoring $(kubectl get pods --namespace knative-monitoring --selector=app=grafana --output=jsonpath="{.items..metadata.name}") 3000
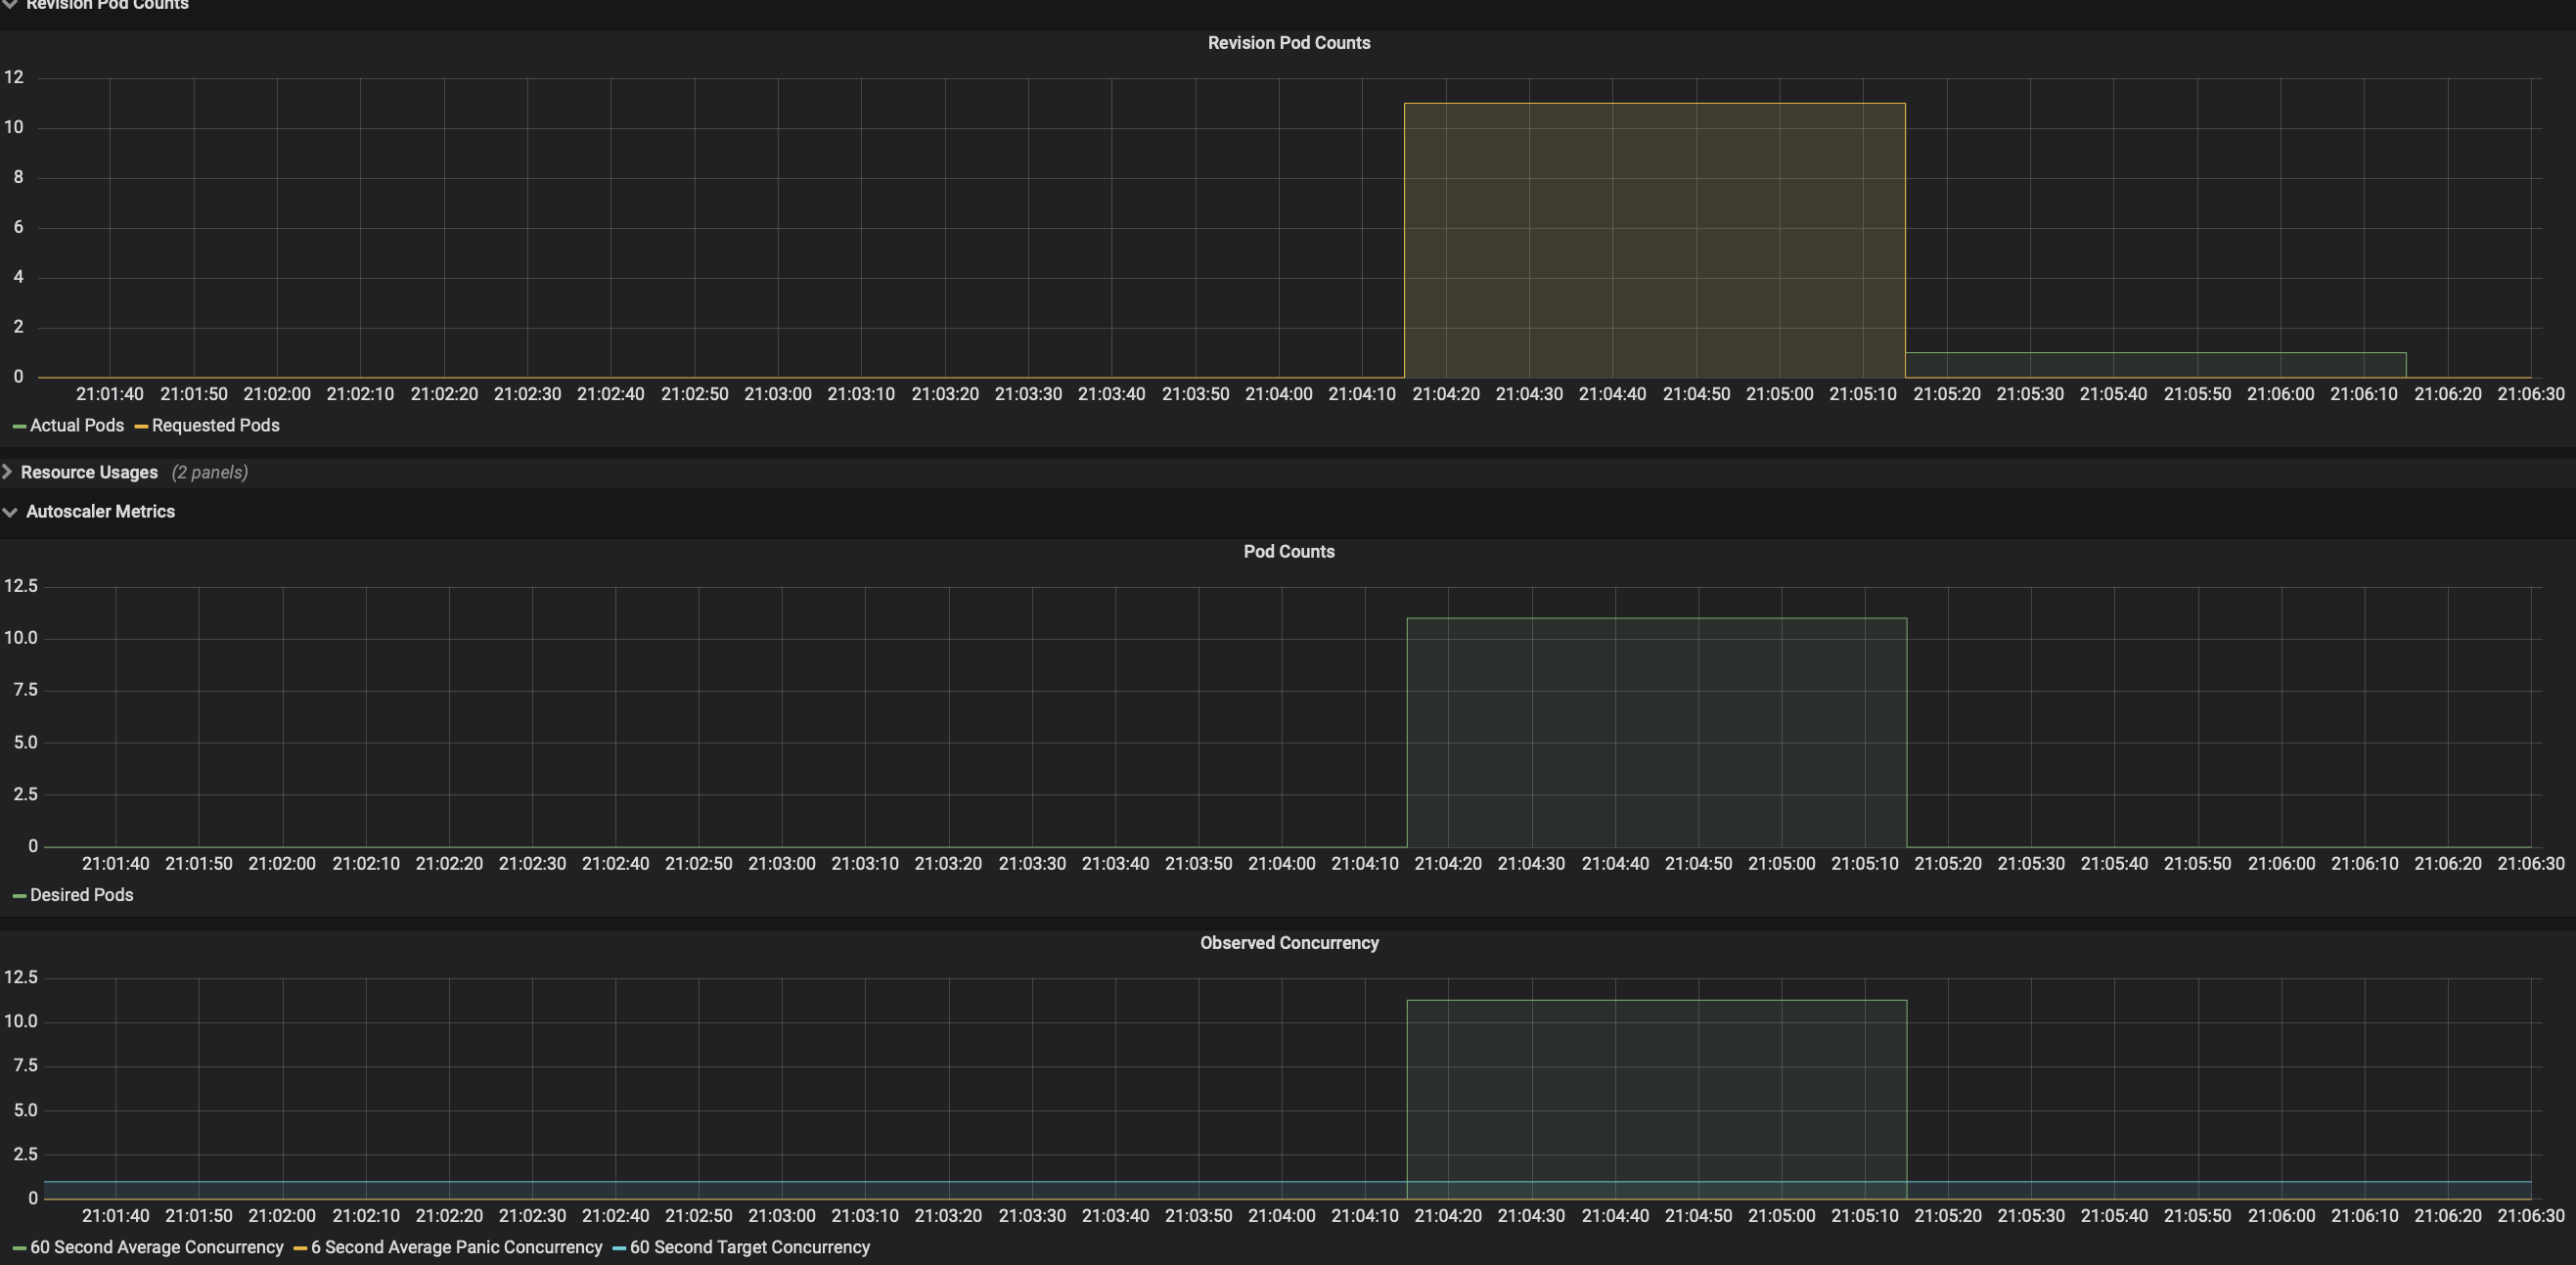
The autoscaler calculates average concurrency over a 60-second window, so it takes a minute to stabilize at the desired concurrency level. However, it also calculates a 6-second panic window and will enter into panic mode if that window reaches 2x target concurrency. From the dashboard, you can see that it enters panic mode in which the autoscaler operates on a shorter and more sensitive window. Once the panic conditions are no longer met for 60 seconds, the autoscaler will return to the 60-second stable window.
Autoscaling on GPU
Autoscaling using GPU metrics can be challenging as GPU utilization can fluctuate dramatically depending on the task. Thanks to Knative's concurrency-based autoscaler, scaling on GPU is easy and effective!
Create the InferenceService with GPU Resource
Apply the TensorFlow GPU example:
apiVersion: "serving.kserve.io/v1beta1"
kind: "InferenceService"
metadata:
  name: "flowers-sample-gpu"
spec:
  predictor:
    scaleTarget: 1
    scaleMetric: concurrency
    model:
      modelFormat:
        name: tensorflow
      storageUri: "gs://kfserving-examples/models/tensorflow/flowers"
      runtimeVersion: "2.6.2-gpu"
      resources:
        limits:
          nvidia.com/gpu: 1
Test InferenceService with Concurrent Requests
First, determine the ingress IP and ports and set INGRESS_HOST and INGRESS_PORT.
Send 30 seconds of traffic maintaining 5 in-flight requests using sample input data:
MODEL_NAME=flowers-sample-gpu
INPUT_PATH=input.json
SERVICE_HOSTNAME=$(kubectl get inferenceservice $MODEL_NAME -o jsonpath='{.status.url}' | cut -d "/" -f 3)

hey -z 30s -c 5 -m POST -host ${SERVICE_HOSTNAME} -D $INPUT_PATH http://${INGRESS_HOST}:${INGRESS_PORT}/v1/models/$MODEL_NAME:predict
Summary:
  Total:	30.0152 secs
  Slowest:	9.7581 secs
  Fastest:	0.0142 secs
  Average:	0.0350 secs
  Requests/sec:	142.9942

  Total data:	948532 bytes
  Size/request:	221 bytes

Response time histogram:
  0.014 [1]	|
  0.989 [4286]	|■■■■■■■■■■■■■■■■■■■■■■■■■■■■■■■■■■■■■■■■
  1.963 [0]	|
  2.937 [0]	|
  3.912 [0]	|
  4.886 [0]	|
  5.861 [0]	|
  6.835 [0]	|
  7.809 [0]	|
  8.784 [0]	|
  9.758 [5]	|


Latency distribution:
  10% in 0.0181 secs
  25% in 0.0189 secs
  50% in 0.0198 secs
  75% in 0.0210 secs
  90% in 0.0230 secs
  95% in 0.0276 secs
  99% in 0.0511 secs

Details (average, fastest, slowest):
  DNS+dialup:	0.0000 secs, 0.0142 secs, 9.7581 secs
  DNS-lookup:	0.0000 secs, 0.0000 secs, 0.0291 secs
  req write:	0.0000 secs, 0.0000 secs, 0.0023 secs
  resp wait:	0.0348 secs, 0.0141 secs, 9.7158 secs
  resp read:	0.0001 secs, 0.0000 secs, 0.0021 secs

Status code distribution:
  [200]	4292 responses
Autoscaling Customization
Container Concurrency
ContainerConcurrency determines the number of simultaneous requests that can be processed by each replica of the InferenceService at any given time. It is a hard limit, and if the concurrency reaches the hard limit, surplus requests will be buffered and must wait until enough capacity is free to execute the requests.
apiVersion: "serving.kserve.io/v1beta1"
kind: "InferenceService"
metadata:
  name: "flowers-sample"
spec:
  predictor:
    containerConcurrency: 10
    model:
      modelFormat:
        name: tensorflow
      storageUri: "gs://kfserving-examples/models/tensorflow/flowers"
Enable Scale To Zero
KServe by default sets minReplicas to 1. If you want to enable scaling down to zero, especially for use cases like serving on GPUs, you can set minReplicas to 0 so that the pods automatically scale down to zero when no traffic is received.
apiVersion: "serving.kserve.io/v1beta1"
kind: "InferenceService"
metadata:
  name: "flowers-sample"
spec:
  predictor:
    minReplicas: 0
    model:
      modelFormat:
        name: tensorflow
      storageUri: "gs://kfserving-examples/models/tensorflow/flowers"
Autoscaling Transformer and Predictor Components
Autoscaling options can also be configured at the component level. This allows more flexibility in terms of the autoscaling configuration. In a typical deployment, transformers may require a different autoscaling configuration than a predictor. This feature allows the user to scale individual components as required.
apiVersion: serving.kserve.io/v1beta1
kind: InferenceService
metadata:
  name: torch-transformer
spec:
  predictor:
    scaleTarget: 2
    scaleMetric: concurrency
    model:
      modelFormat:
        name: pytorch
      storageUri: gs://kfserving-examples/models/torchserve/image_classifier
  transformer:
    scaleTarget: 8
    scaleMetric: rps
    containers:
      - image: kserve/image-transformer:latest
        name: kserve-container
        command:
          - "python"
          - "-m"
          - "model"
        args:
          - --model_name
          - mnist
The default for scaleMetric is concurrency and possible values are concurrency, rps, cpu, and memory.